Preface: Explaining our market timing models We maintain several market timing models, each with differing time horizons. The "
Ultimate Market Timing Model" is a long-term market timing model based on the research outlined in our post,
Building the ultimate market timing model. This model tends to generate only a handful of signals each decade.
The
Trend Asset Allocation Model is an asset allocation model that applies trend-following principles based on the inputs of global stock and commodity prices. This model has a shorter time horizon and tends to turn over about 4-6 times a year. The performance and full details of a model portfolio based on the out-of-sample signals of the Trend Model can be found
here.
My inner trader uses a
trading model, which is a blend of price momentum (is the Trend Model becoming more bullish, or bearish?) and overbought/oversold extremes (don't buy if the trend is overbought, and vice versa). Subscribers receive real-time alerts of model changes, and a hypothetical trading record of the email alerts is updated weekly
here. The hypothetical trading record of the trading model of the real-time alerts that began in March 2016 is shown below.
The latest signals of each model are as follows:
- Ultimate market timing model: Buy equities (Last changed from “sell” on 28-Jul-2023)*
- Trend Model signal: Bullish (Last changed from “neutral” on 28-Jul-2023)*
- Trading model: Neutral (Last changed from “bullish” on 24-Jan-2024)*
* The performance chart and model readings have been delayed by a week out of respect to our paying subscribers.Update schedule: I generally update model readings on my
site on weekends. I am also on X/Twitter at @humblestudent. Subscribers receive real-time alerts of trading model changes, and a hypothetical trading record of those email alerts is shown
here.
Subscribers can access the latest signal in real time
here.
NASDAQ Hindenburg warnings
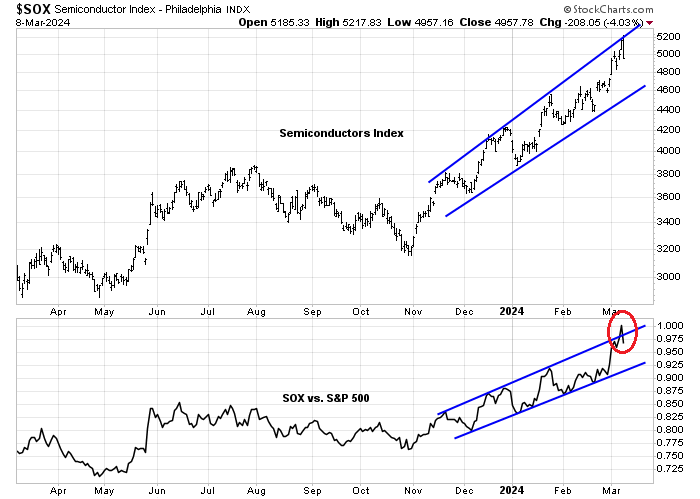
I have been concerned about the extended and frothy nature of the advance in growth stocks. Worries came to a head when the Semiconductors Index rallied through and reversed though an upward trending relative performance channel, indicating a possible blow-off top. Beneath the hood, however, market internals are signaling breadth deterioration for NASDAQ stocks that warn of an impending corrective downdraft.
The ominous sounding but controversial Hindenburg Omen was designed by James Miekka to spot major market tops, though it purportedly only has many false positives and a success rate of 25%. The indicator looks for the combination of an increasingly bifurcated market, as measured by breadth divergences, and a downside momentum break from an uptrend.
NASDAQ stocks have been flashing Hindenburg Omens starting in January and the warnings continued into February. While the signal isn’t perfect, the history of such clusters in the last 10 years has usually resolved in declines, shown as pink bars), while the instances of false positives (grey bars) have been relatively low.
The full post can be found
here.